
One of the most important parts of creating an automation starts before you even need to open up Zapier or Integromat.
Every project needs a plan that’s up to the task, and before you start connecting apps together in the platform of your choice, you should start by documenting your ideas through some business process mapping.
If you’ve never heard the term before, it might sound a little intimidating, but don’t worry. For all intents and purposes here, it simply refers to building a flowchart of a business process - in this case, the business process that you want to automate.
Creating a flowchart will help you to organize your ideas, keep track of your progress as you’re building the automation, and easily explain how the automation works to colleagues or clients.
Let’s jump right in.
There are many programs available for creating flowcharts, but our preferred software at XRAY is Lucidchart.
Lucidchart is a powerful app that allows you to connect data to your diagrams and offers an extensive library of sophisticated templates and shapes. If you’d prefer, you can also use a free alternative like Google Draw for business process mapping, but this tutorial will focus on Lucidchart controls and features.
In Lucidchart, you can simply drag shapes from the panel on the left onto your canvas. Once they’re on the canvas you can edit their content and connect your shapes to show a flow and a hierarchy.
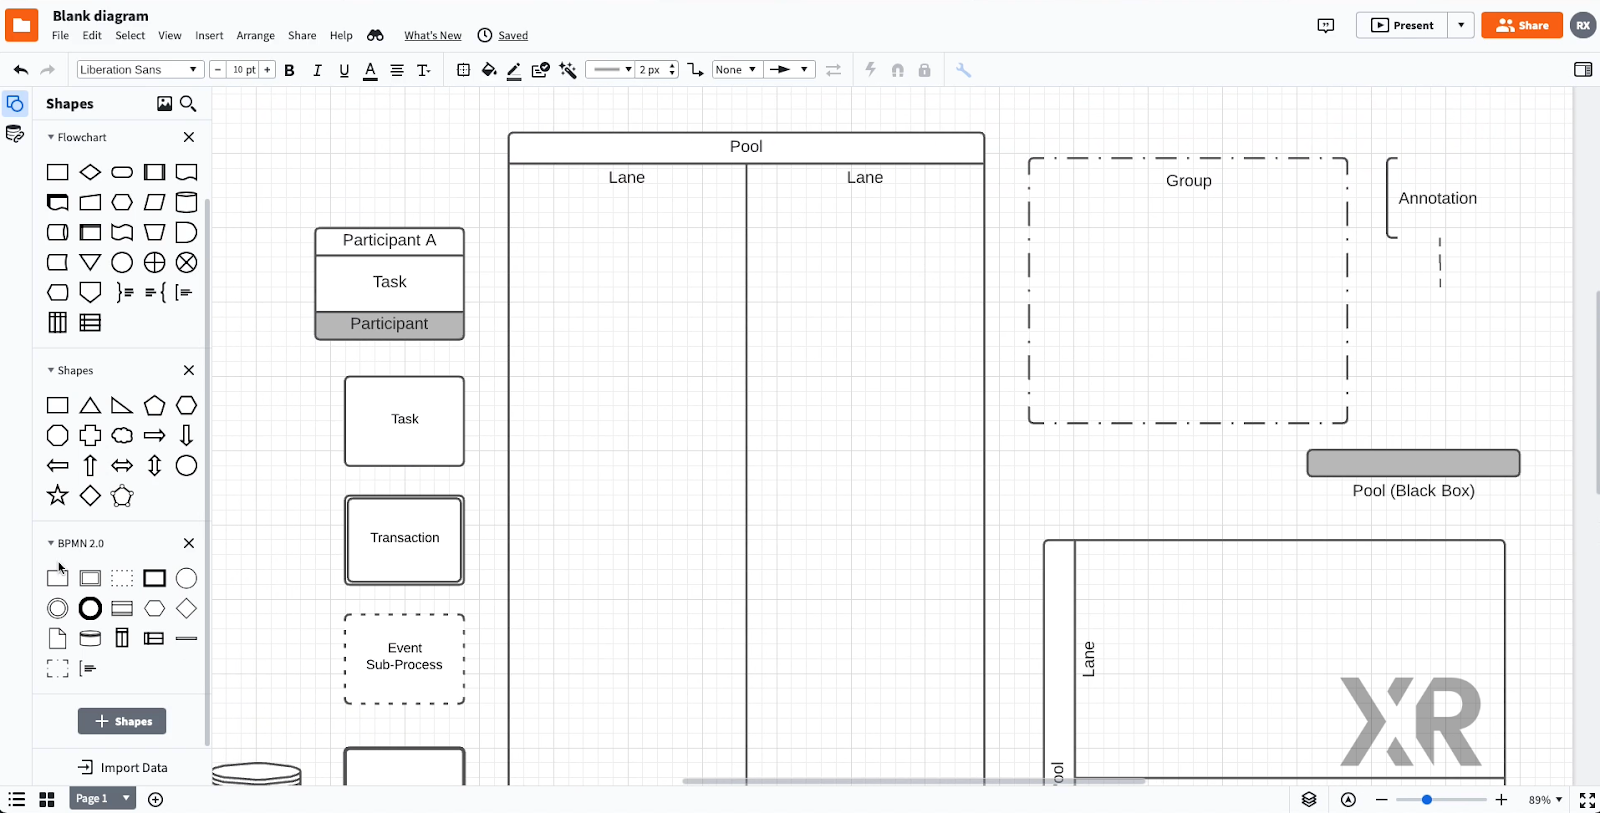
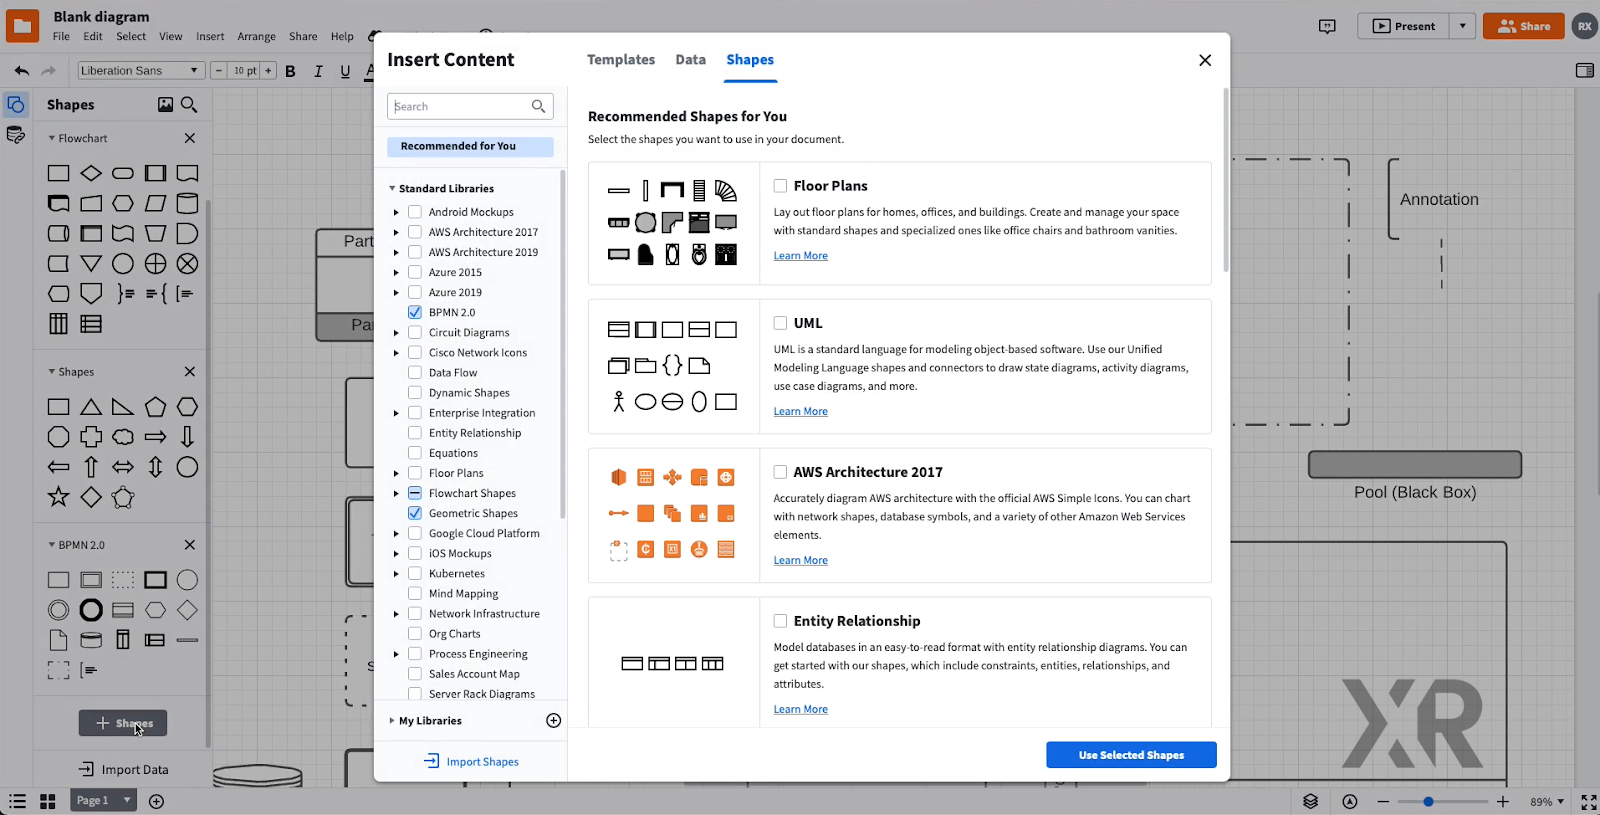
In this post and our tutorial video, we use the BPMN 2.0 Library of shapes, a common standard for business process mapping which you can add to your flowchart by clicking on the “+ Shapes” button underneath the shapes panel.
If you haven’t used Lucidchart before, play around with it a bit to get familiar with the UI. It’s generally an intuitive and straightforward app, but you can always check their support docs for help.
Once you’re all set up in Lucidchart, it’s time to start documenting the process itself.
Note: If you’re unsure of what to automate at your business, check out our post about robotic tasks to get started.
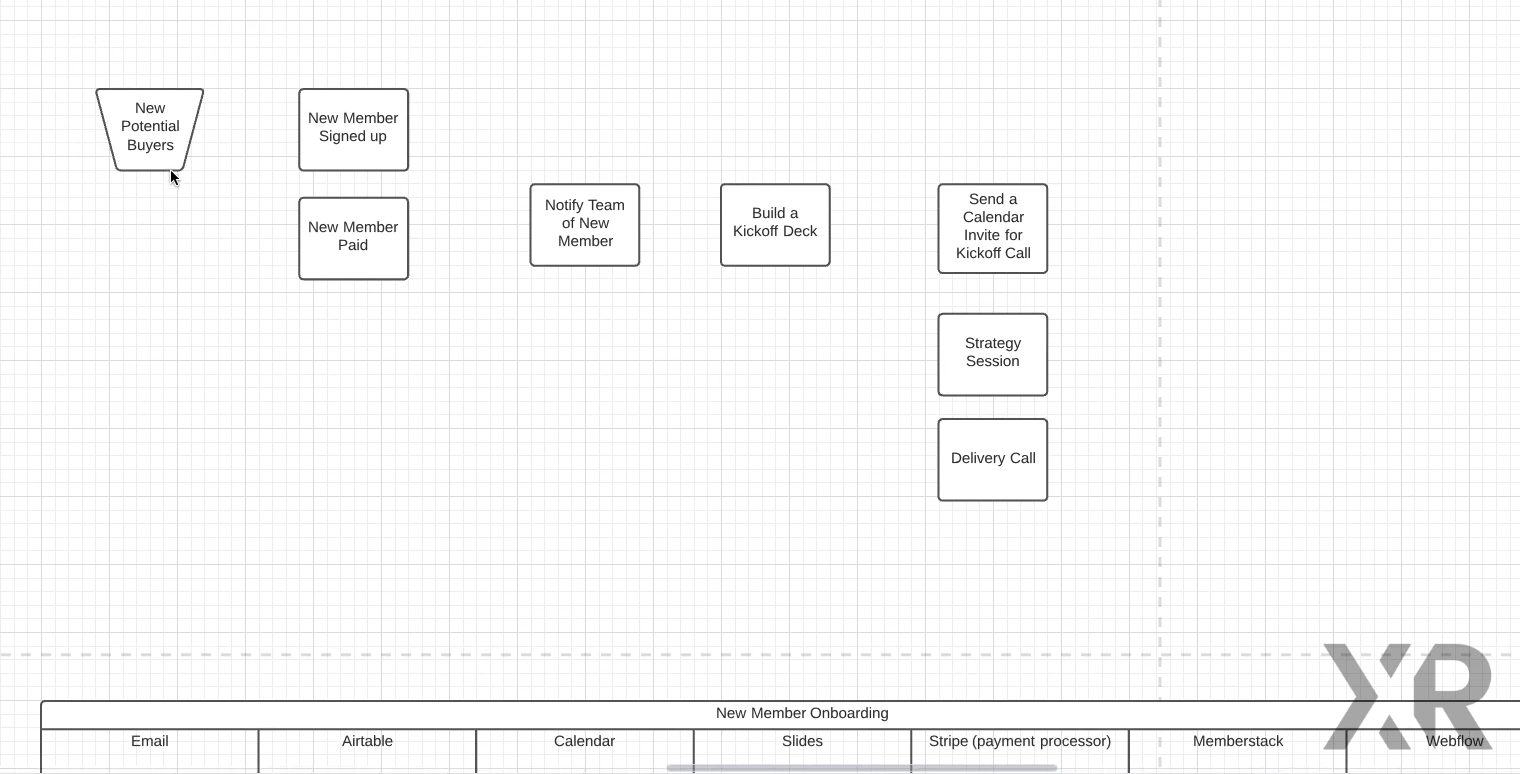
Create a shape for each action, event, or other element that’s part of this process. To make it easy to follow your flowchart chronologically, put the events that occur first at the top of your chart, and go down from there. Events that happen simultaneously can be on the same level.
As a general rule, each shape should document one specific event or action. For instance, creating a Kickoff Meeting agenda and putting that agenda into a calendar invite would be two separate tasks, even though they’re closely related.
Additionally, you should put any automated action that requires a new step in the automation software into its own shape. This will make it easier to translate your flowchart into an automation when it's time to start building.
Once you’re confident that you have every step of the process documented, use arrows to connect each shape and indicate how each action or event relates to another. For instance, if a certain event prompts two actions, make sure to draw arrows from the event to both actions.
Understanding which events trigger which actions will be vital when constructing your automation, especially if you’re dealing with a process that has multiple branching paths.
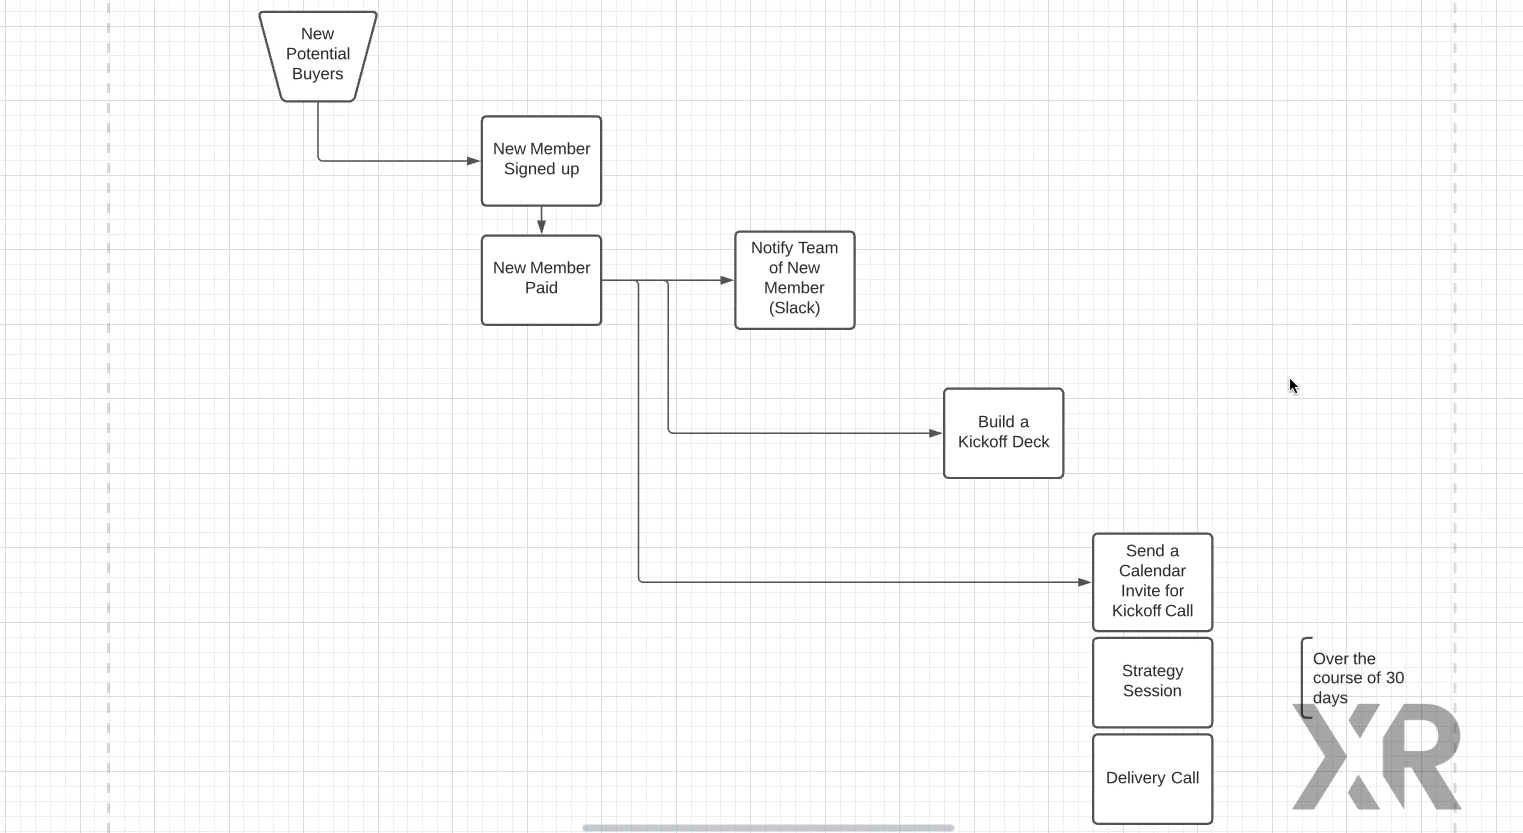
You can draw arrows in Lucidchart by just hovering over a shape, clicking on one of the circles that appears, and dragging to draw a line. Once your shapes are connected to form a clear flowchart, you can get ready to add more context with swimlanes.
Finally, it’s time for a quick trip to the pool. The “pool” shape allows you to add swimlanes to your flowchart, which is a convenient way to add lots of helpful context to your flowchart.
For an automated process, you’ll want to create a swimlane in the pool diagram to represent each piece of software used in the process. You’ll likely need to create more lanes to accommodate all of the apps involved.
Drag your flowchart on top of the pool diagram, and start moving each shape into the appropriate lane. You might want to make a copy of the shapes you’ve created to preserve your work so far.
If a task involves multiple apps at once, you can stretch the shape to overlap all of the relevant lanes. Most of the time, however, each shape should only be in one lane.
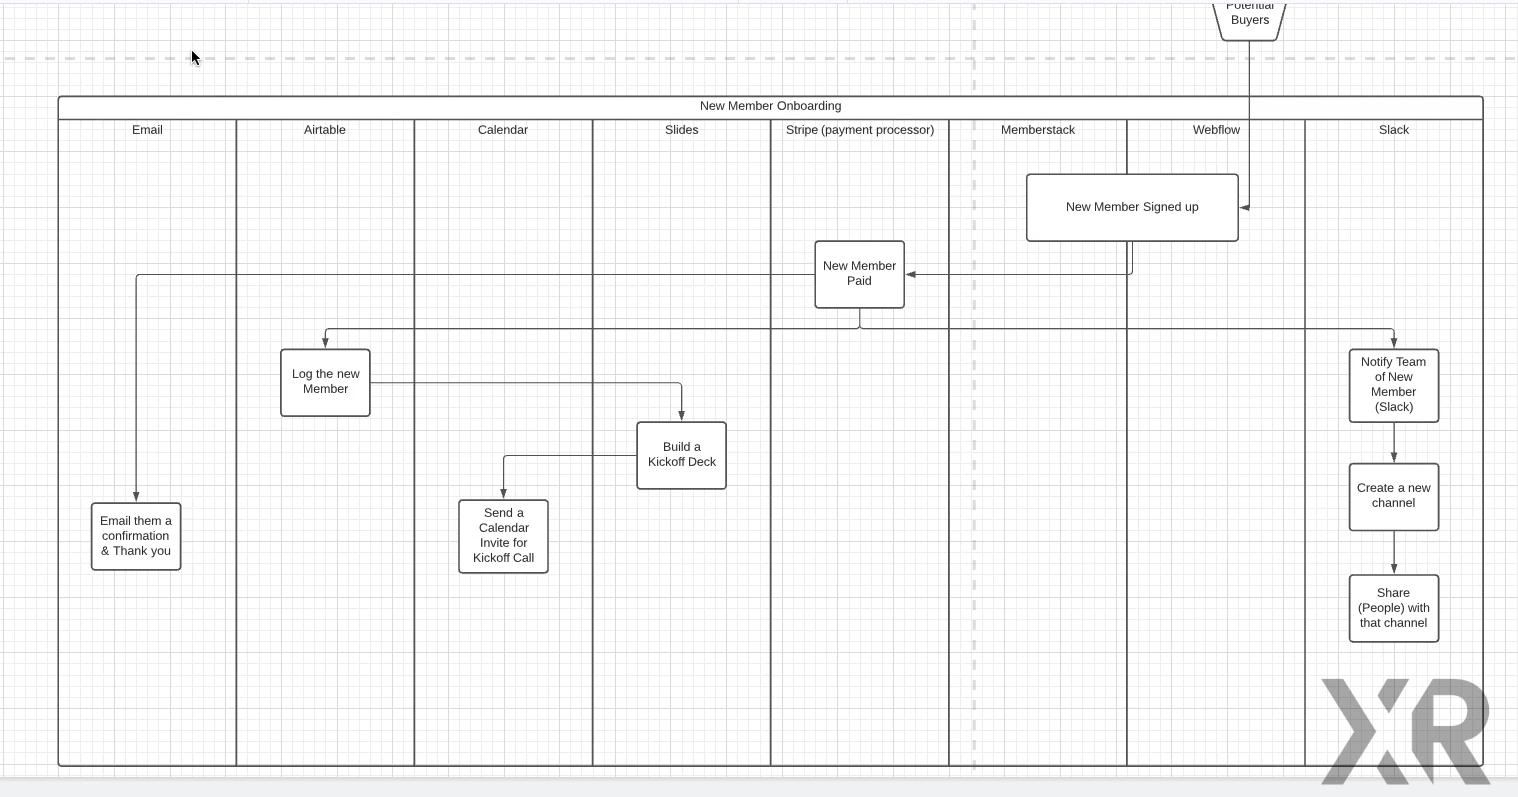
Mapping your process into swimlanes will often make you realize that you left out some important steps, so make sure to add anything that comes to mind. You can also use annotations to provide any additional information about the process.
That’s all there is to it. Now you can use your flowchart to start building your automation.
Business process mapping is an extremely useful method of documenting an automation that will give clarity and context to anyone who needs to understand the process. Whether you need a roadmap to follow while you’re creating the automation, or you just need a way to explain your idea to a colleague or client, business process mapping can help you get it done.
If you’d like to see a live demo of business process mapping, check out the video on our YouTube channel.
If you'd like to learn more about planning and building no-code automations, check out our blog or our YouTube channel. You can also follow XRAY on Twitter, Facebook, or LinkedIn.

.pptx.png)
.pptx.png)
